
By Weiyi Zhang, Ph.D., Senior Agricultural Economist, Manulife Investment Management
We examine the evolution of California’s tree nut sector, its expanding role relative to other crops, and its impact on statewide water use, as well the role of almonds and other tree nuts in increasing the competitive position and economic resilience of the state’s farm economy.
The reoccurrence of drought conditions in California in 2021 has focused attention on almond producers as a major user of the state’s agricultural water resource. The rapid expansion in the state’s almond acreage over the past two decades, and the significant water demands of tree nut production compared with other crop types have raised questions around the role of almond production in California’s overall farm economy and the durability and sustainability of the state’s almond industry. At the same time, the rollout of the California Sustainable Groundwater Management Act will place additional future regulatory constraints on the availability of water for California’s agricultural sector.
CHART 1: Total acreage dedicated to the production top agricultural crops in California decreased
Total acreage dedicated to top 20 agricultural crops in California 2007-2020 (000 acres)
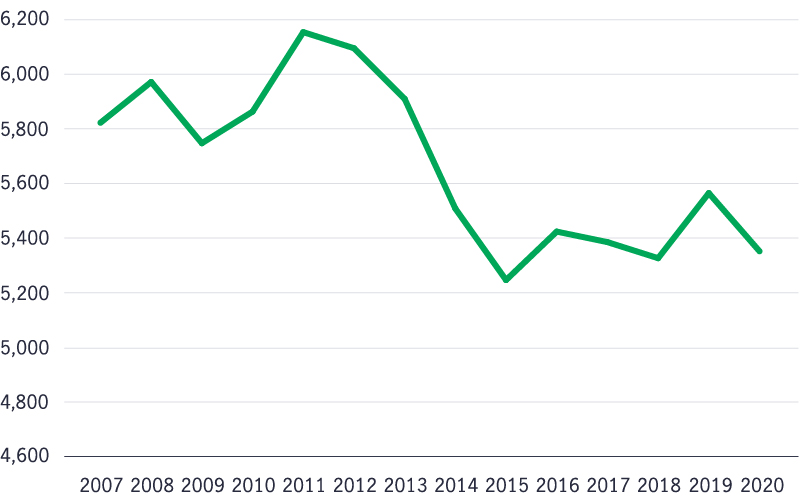
Source: USDA NASS, as of September 2021.
Between 2007 and 2020, total bearing acreage for the top 20 crops in California experienced a 464,300-acre (–8 percent) decline. Diving into the details of acreage shifts during the past 14 years, 7 of the top 20 crops, including tree nuts (e.g., almonds, pistachios, and walnuts), grapes, and tangerines, added 1.15 million bearing acres during this period. Combined production of almonds, pistachios, and walnuts increased by 1.03 million acres, with almonds leading all other crops in acreage gains, adding 610,000 additional bearing acres and accounting for 53 percent of all crop acreage increases from 2007 to 2020.
CHART 2: Tree nuts and fruits replaced acreage previously used for feed crops and hay crops in California
Major crop acreage changes in California, 2007–2020 (000 acres)

Source: USDA NASS, as of September 2021.
Acreage Loss is Concentrated in Water-intensive Row Crops
Over the same period, 13 California crops lost bearing acreage, for a net decline of 1.62 million acres. Losses in acreage were heavily concentrated in water-intensive feed crops, such as alfalfa, hay, and silage corn, which are often double and triple-cropped each year. Alfalfa acreage experienced the most pronounced single-crop decline, falling by 515,000 acres and accounting for over a third of all crop acreage decrease. Row crops, such as corn, wheat, and cotton experienced combined losses of nearly one million acres, representing 59 percent of the total net acreage decline over the 14-year period. California cotton acreage also decreased by 60 percent between 2007 and 2020. The losses in feed crops reflect the declining competitive position of California’s dairy and livestock producers versus other regions. California’s dairy and beef production has been in decline, while dairy production in Wisconsin, Idaho, and Texas has grown, and cattle production in Nebraska, Kansas, and Iowa has increased. The losses experienced by cotton, wheat, and corn were also significant and occurred in highly competitive markets characterized by tight margins and a wide range of supply regions.
CHART 3: Cattle and dairy industries experienced decline, 2007–2020
California’s calf (1,000 slaughter heads) and milk production share in the U.S. (%)

Source: USDA NASS, as of September 2021. The California milk production share is the percentage of California milk production’s share of the national total production.
Economics Drives Acreage Shift
The acreage shift among crops in California during the past 14 years reflects economic decisions made by farmers in the state. The degree to which the acreage of various crops expanded in California was positively correlated with each crop’s economic value as measured by total average revenue per acre. Corn and alfalfa, which yielded the lowest economic value per acre for the period 2007 to 2020, also experienced the steepest acreage reduction. During the same period, almonds, pistachios, and walnuts were the top three crops in acreage expansion and registered strong positive per acre revenue. Some tree fruits, which experienced better per-acre revenues than tree nuts, still faced other market challenges, such as stagnant per capita consumption growth (e.g., peaches and nectarines) or competition from imports (e.g., lemons), and achieved only negligible acreage increases. The robust expansion of tree nut production reflects California’s competitive position in global production. The state’s favorable growing conditions for tree nuts have allowed California to capture a dominant share of global almond production (80 percent), a major share of pistachio production (47 percent), and a lesser, but still significant, position for walnut production (28 percent). In addition, global demand for tree nuts has been steadily trending higher over the past two decades as consumers recognize tree nuts as healthy diet options. In comparison, other fruit crops with higher total revenue per acre than tree nuts face more fierce competition globally, as the United States accounts for just 12 percent and 3 percent of global lemon/lime and peach/nectarine production, respectively.
CHART 4: Acreage Shifts Translate into Economic Value
The relationship between total revenue per acre (US$/acre) and area shift (000 acres)
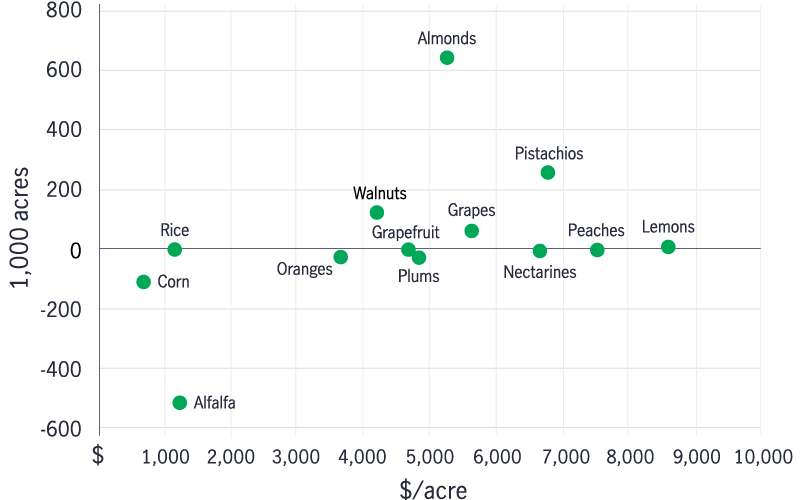
Source: USDA NASS, as of September 2021. The total revenue per acre is the product of average price and yield for each crop in California from 2007 to 2020. Area shift is the change in bearing acreage for the same time period.
CHART 5: Almonds and pistachios use less water per acre compared with alfalfa and rice
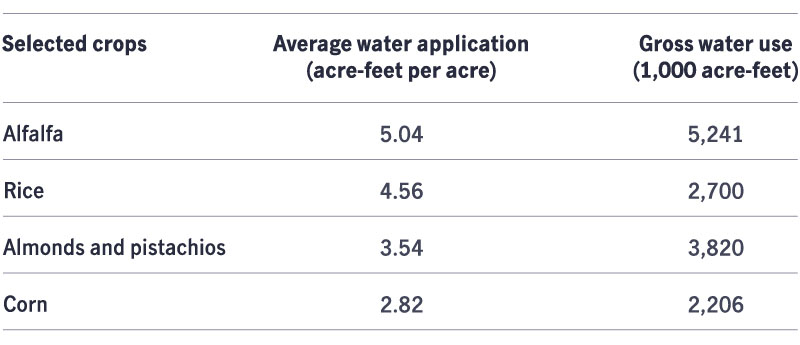
Source: “Jobs per drop irrigating California crops,” UC Davis Center for Watershed Sciences, April 28, 2015.
CHART 6: California irrigation water usage declines despite higher tree nut acreage
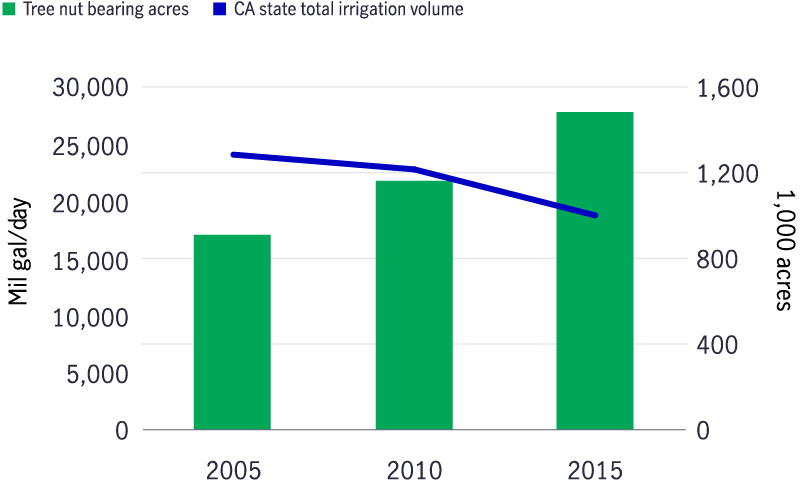
Source: Tree nut bearing acreage: USDA NASS, as of September 2021; Irrigation water: U.S. Geological Service Water Resources, Water Use Data for California as of September 2021. Tree nut-bearing acres include almonds, pistachios, and walnuts. Total irrigation water use includes withdrawals of self-supplied fresh and saline groundwater and self-supplied withdrawals of fresh and saline surface water.
Conversion to Tree Nuts Yields Irrigation Efficiency and Reduced Water Demand, Along with Economic Benefits
In addition to improving the per-acre income of California farmland, the shift in acreage from alfalfa and other feed and row crops to tree nuts has been positive for the state’s water use profile, as nut crops generally use less water than feed crops. The most water-intensive crop per acre in California is alfalfa, averaging five acre-feet per acre, followed by rice, which consumes 4.6 acre-feet per acre; alfalfa and rice accounted for nearly eight million acre-feet of water use in total. In comparison, almonds and pistachios are estimated to use 3.5 acre-feet per acre. In its totality, the increase of tree nut production, especially almond and pistachio acreage expansion, hasn’t been positively correlated with irrigation water consumption in California. While historical comparisons of irrigation water usage and tree nut acreage in California reflect limited historical data, point data on irrigation water use is available for the years 2005, 2010, and 2015. Based on this information, California irrigation water use decreased from over 24 billion gallons/day in 2005 to 19 billion gallons/day in 2015, a 22 percent decline, despite an expansion in the state’s total bearing acreage of tree nuts of over half a million acres (63 percent increase). This decline in irrigated water usage reflects both the relatively lower water demands of the tree nuts compared with alfalfa and rice and the improved water use efficiency achieved in the irrigation of tree nut orchards. For example, surface irrigation area for all crops in California decreased 26 percent from 2005 to 2015, while acreage applying micro-irrigation systems, such as sprinklers and drippers, increased 35 percent during the same period. The higher returns associated with almond production have allowed for the deployment of advanced water technology and management to optimize irrigation water use.
CHART 7: Increase in micro-irrigation system helps reduce irrigation water usage
Total irrigation amount (mil gal/day) and land area by irrigation system 2005-2045 (000 acres)
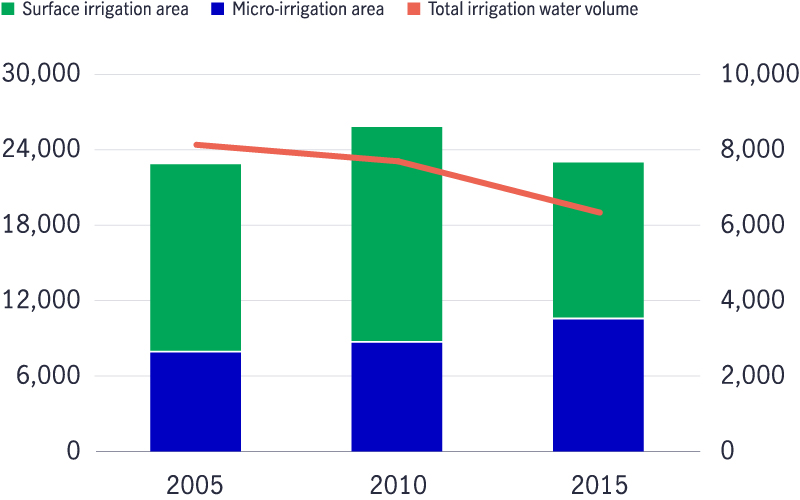
Source: U.S. Geological Service Water Resources, Water Use Data for California, https://waterdata.usgs.gov/ca/nwis/water_use? as of September 2021. The total irrigation water use includes withdrawals of self-supplied fresh and saline groundwater and self-supplied withdrawals of fresh and saline surface water.
More Crops and More Jobs Per Drop
In addition to increasing economic productivity and easing pressure on the state’s agricultural water resources, the turnover of acreage from feed and row crops to tree nuts has opened job opportunities in rural communities. According to data collected by the UC Davis Center for Watershed Sciences in 2015, almond and pistachio crops were responsible for over 5,700 more jobs, or 39 percent more than alfalfa and row crops combined, while using 36 percent less water. In terms of efficient value creation by water, less than one job was created per thousand acre-feet of net water applied in alfalfa production, while production of almonds and pistachios generated nearly five jobs with the same amount of water applied. We believe investing in tree nuts goes beyond the financial returns captured by increased farmland productivity and extends to empowering rural communities.
CHART 8: Almonds and pistachios use less water and create more jobs than alfalfa and row crops
 Source: UC Davis Center for Watershed Sciences, Jobs per drop irrigating California crops, April 28 2015. the net water use is volume consumed by crops, which is the water applied minus runoffs and ground seepage.
Over the past two decades, California agriculture has experienced a paradigm shift, moving from production of feed crops, such as hay and alfalfa, to tree nut production. The shift, driven by changing market conditions and on-the-ground economic decisions, has improved farmland productivity, advanced rural economic development, and reduced demand on increasingly scarce water resources. Tighter water regulation and increasingly scarce water availability due to climate change will likely present the California farm sector with additional challenges in the future. To meet these challenges, it will need to draw on historical resilience and adaptive innovation to overcome financial and natural obstacles.
Increasing emphasis on sustainable agricultural management practices and continued capital investments in research and development should allow California’s farm segment to continue to make environmentally sustainable positive contributions to the state’s economy and to its overall social fabric.
For more timberland and agriculture Viewpoints from Manulife Investment Management’s please click here: Viewpoints and market insight | Institutional | Manulife Investment Management (manulifeim.com)
Important disclosures
This material was prepared solely for informational purposes, does not constitute a recommendation, professional advice, an offer or an invitation by or on behalf of Manulife Investment Management to any person to buy or sell any security or adopt any investment strategy, and is no indication of trading intent in any fund or account managed by Manulife Investment Management. Manulife, Manulife Investment Management, Stylized M Design, and Manulife Investment Management & Stylized M Design are trademarks of The Manufacturers Life Insurance Company and are used by it, and by its affiliates under license.
ABOUT THE AUTHOR
 Weiyi Zhang is a senior agricultural economist at Manulife Investment Management with responsibility for driving agricultural economic initiatives. In this role, he’s directly involved in farmland transactional due diligence and initiating new investment strategies and concepts. In addition, he leads the global agricultural economic, financial, and statistical analytical efforts, including commodity price forecasting, portfolio analysis, and authoring thought leadership publications. Previously, Zhang was the senior natural resource economist, where he supported economic research and analysis for the group’s timberland and farmland business sectors. He has a B.S. in Agricultural and Applied Economics, an M.F.R. in Forest Business, and a Ph.D. in Forest Finance and Economics, all from the University of Georgia.