

This article will be featured in the next GAI Gazette, Volume 7, Issue 1, which will be distributed digitally in conjunction with the annual Global AgInvesting flagship conference, which will be held virtually on August 25-27, 2020.
Join us for this three-day event and gain valuable insight and learn best practices from the expert speaking faculty. Learn more and register.
By Daniel Serna, Hancock Natural Resource Group
The COVID-19 pandemic has triggered pronounced changes in consumer behavior and business processes as the world has adjusted to social distancing, quarantines, and the suspension of business operations and transportation systems across the globe. Looking ahead, investors are trying to understand which changes will persist post-pandemic and how to adapt. In the U.S. food and agriculture sector, some key aspects of consumer behavior, production, and delivery logistics were disrupted by the COVID-19 pandemic, including consumer focus on health and wellness, home grocery delivery, cross-border trade, and labor availability. The magnitude and speed of these changes may leave lasting effects across a range of global agricultural markets. The most meaningful impacts are likely to stem from increased food consumption at home and increased online shopping and direct food sales, while trade and automation will become increasingly important drivers of agricultural income. These pandemic-triggered shocks will likely extend beyond the current situation and continue to shape demand and supply conditions in the agriculture sector. The analysis in this piece is focused primarily on data around U.S. markets; however, we expect that some of these trends will also be important around the world.
Food Consumption at Home Versus Away
Food consumption has long been shifting to outside the home, with increased use of restaurants, snacking, and food services (school- and work-provided meals and snacks). With the closure of restaurants, suspension of travel, and working at home, this trend reversed sharply. Even with the economy reopening, lingering caution in social behavior, as well as more fundamental changes in how and where we work and attitudes regarding travel and recreation, could present persistent obstacles to away-from-home food consumption. Any potential medium- or long-term change could have a major impact on food spending, the categories of food purchased, and the supply chain requirements for processing, packaging, and distribution. Certain foods are consumed with greater frequency in food service than in home consumption, such as potatoes (for French fries) and onions. Cheese is also more common in food service meals than grocery meals; however, pizza, by delivery and takeout, remains a popular option during the pandemic. As restaurants, schools, universities, and entertainment establishments reopen, persistently higher levels of employees working from home, traveling less, and substituting other recreational activities for patronizing restaurants could reshape food consumption.
Food Away from Home Surpassed Food at Home in 2010 and Continued to Gain Share
U.S. nominal food expenditures ($ millions)[1]
Online Grocery Shopping and Home Delivery
Within the food-consumed-at-home segment, grocery delivery is a small and rapidly growing area, doubling in dollar volume from 2012 to 2019, well above the growth rate of total food-at-home spending. An online trend not included in home delivery is the increased use of the online ordering and store pickup services offered by an increasing array of large and small food retailers, particularly in 2020, due to social distancing concerns. A somewhat related growth area, especially in 2019, is the direct purchase of food from farmers, manufacturers, and wholesalers by consumers, which is aided by the ongoing trend of increased consumer focus on local foods and on buying directly with fewer steps in the supply chain. This direct food purchase area surged in 2019 and is further enabled by online ordering from these food businesses to consumers directly.
At-home Food Spending Growth is Highest in Grocery Delivery and Direct Sales to Consumers
U.S. nominal food expenditures ($ millions)1

Compared against the broader retail sector, a dramatically lower share of groceries is purchased online, at 1 percent versus 10 percent for total retail trade. During the spring of 2020, the number of consumers turning to online and home food delivery surged, and a portion of these consumers will likely remain regular online shoppers even after the pandemic has long passed. Until 2013, the growth rate of online food store sales lagged the growth of total U.S. online retail; however, with larger grocery stores and big-box retailers offering full online platforms, the growth rate for food and beverage has accelerated, with high growth expected for 2020 and positive momentum expected in upcoming years. The rise of online grocery shopping and delivery could increase concentration in distribution into major food retailers, such as Walmart and Target. It could lead to fewer impulse purchases near the cash register, but more targeted impulse purchases recommended by shopping algorithms. The ability to compare prices, along with more overall price transparency, could make consumers more price sensitive, creating further pressure on margins in the value chain.
Share of Grocery Sales Made Online Lags Other Retail Sectors
Total U.S. retail vs. food and beverage stores—online sales share and annual growth (%)[2]

Trade
Supply chain interruptions during the COVID-19 pandemic have led consumers and governments to reconsider long-distance trade generally, with food being no exception. U.S. agriculture has long registered a trade surplus, although increasing trade tensions in 2018 and 2019 have narrowed the gap. A reduction in the scale of global trade, whether due to government policies or concerns about the vulnerability of supply chains to cross-border shipping, could be detrimental to trade-dependent sectors, especially those with multiple competing regions, such as grains, oilseeds, and cotton.
Agricultural Trade Growth Slows in 2018 and 2019
U.S. agricultural exports and imports ($ billions)[3]
 Disruptions in Seasonal Labor and Investment in Automation
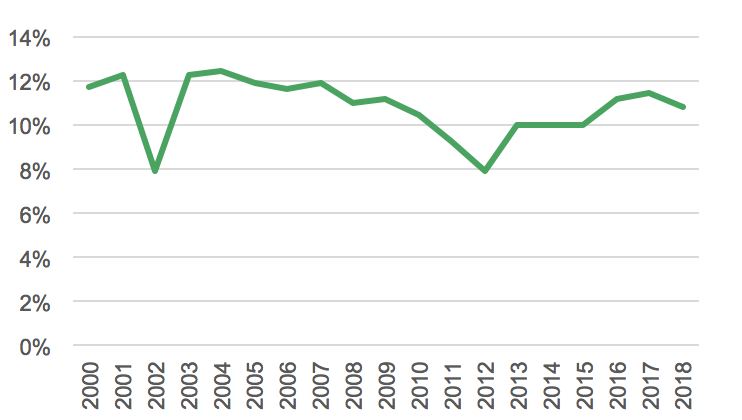
The COVID-19 pandemic has sparked concerns about potential shortages in seasonal labor due to tighter restrictions on visas, slowdowns in border crossings, and difficulties in recruiting workers, given fears of contagion in field housing. However, many seasonal workers previously employed in the United States received waivers for in-person visa interviews, and concerns have shifted to maintaining worker health through the peak of the harvest season in the summer and fall amid continued virus risks. Over the last two decades, the share of farm cash expense for labor in the U.S. farm sector hasn’t moved materially lower, but COVID-19 could be a catalyst for another round of automation in harvesting and processing crops.
Concerns about labor availability during the pandemic and historically low interest rates may boost investment in further automation in the U.S. farm sector, resulting in U.S. agriculture substituting capital for labor, reducing the impact of potential interruptions in the availability of seasonal labor.
U.S. Agricultural Labor Share Remains Flat Despite Recent Technology Labor share of total cash farm production expenses (%)[4]
Health and Wellness Categories Are Poised for Continued Growth
Over the last decade, consumer spending on fruits and vegetables eclipsed total spending on meats and poultry. In 2010, fruit and vegetable spending passed meat and poultry for the first time since the U.S. Bureau of Labor Statistics Consumer Expenditure Survey began in 1984. When meat supplies were constrained due to infections at large meat-packing plants in March and April 2020, prices for meat rose over 4 percent[5] in April, providing consumers with additional reasons to shift to plant-based meat alternatives and other plant-based protein sources. The pandemic also coincided with the continued rollout of a number of high-profile meat substitutes, including plant-based protein products at quick-service outlets, accelerating the market penetration of these products. Plant-based meat alternative sales growth is expected to reach $5 billion in 2020.[6] With concerns of healthy living elevated during the pandemic, consumers have turned to more fruits and vegetables; from the weeks ending March 8 through June 7, fresh fruit and retail sales were up compared with 2019.[7]
U.S. food spending gradually shifts from meats to produce
U.S. consumer expenditure survey, per year ($)[8]

Looking Forward
From the perspective of a farmland investor, change generates risks – and opportunities. The potential longer-term impacts of the COVID-19 pandemic on fundamental patterns of consumer behavior, production inputs, and logistics could ripple across the food and agriculture system. Overall, the food and agriculture sector is expected to rebound from the global economic pullback with new opportunities for consumers and suppliers across the agriculture value chain in these areas of growth. As data continues to emerge, the lasting impact will be clearer, and the food supply chain will evolve. We expect continued momentum in the trends of health and wellness foods, agricultural production automation, and online grocery shopping. Over the next few years, we could see the reversal of the long-standing trend favoring increased eating away from home, and the sustained expansion in international trade in agricultural products could lose some of its forward momentum.
The lingering social and economic impacts of the pandemic will be important factors shaping global food and agricultural markets in the coming decade but, at the same time, they may create new opportunities across the agriculture value chain. Products consumed at home, favored in grocery delivery, purchased directly, and considered healthy may benefit, while certain types of crops featured more prominently in food service or more reliant on exports may see slowing spending or consumption levels. Across all products, the sustainability of food production, processing, and delivery will continue to grow in importance for consumers and businesses. Through investment selection and management, investors will have the opportunity to help capitalize on new investment in these growth areas, meeting the latest demand for sustainably produced agricultural products.
ABOUT THE AUTHOR
 Daniel Serna is associate director, senior agricultural economist for Hancock Natural Resource Group (HNRG) and is responsible for leading global economic market research for the farmland investment business. In addition, he is directly involved with investment strategy and communicating farmland investment characteristics to current and prospective investors. In this role, he produces market outlooks and price forecasts for major crops produced on client properties. Before joining HNRG, Serna was an associate director with MetLife Agricultural Finance, where he originated farm and ranch real estate loans, including business development, credit analysis and farmland valuations. Prior to MetLife, Serna was a business analyst with Agri-Mark/Cabot, a vertically integrated cooperative of 1,000 dairy farmers, where he was directly involved in commodities futures and options. Serna holds a BA in Economics from Yale University and an MBA from Harvard Business School.
SOURCES
[1] “Food Expenditure Series,” USDA Economic Research Service, June 2020, https://www.ers.usda.gov/data-products/food-expenditure-series/.
[2] “E-Commerce Statistics (E-STATS),” U.S. Census Bureau, June 2020, https://www.census.gov/programs-surveys/e-stats.html.
[3] USDA Foreign Agricultural Service Global Agricultural Trade System, June 2020, https://apps.fas.usda.gov/gats/default.aspx.
[4] USDA Farm Income and Wealth Statistics, June 2020, https://www.ers.usda.gov/data-products/farm-income-and-wealth-statistics/data-files-us-and-state-level-farm-income-and-wealth-statistics/.
[5] “Another Look at Availability and Prices of Food Amid the COVID-19 Pandemic,” USDA, May 2020, https://www.usda.gov/media/blog/2020/05/28/another-look-availability-and-prices-food-amid-covid-19-pandemic.
[6] “Whole Foods, Kroger Lead $5 Billion Plant-Based Charge,” Winsight Grocery Business, June 2020, https://www.winsightgrocerybusiness.com/retailers/whole-foods-kroger-lead-5-billion-plant-based-charge.
[7] “Fresh fruit boosts produce sales growth in early June,” The Packer, June 2020, http://digitaledition.qwinc.com/publication/?i=664335&article_id=3701638&view=articleBrowser&ver=html5.
[8] “Consumer Expenditure Survey,” U.S. Bureau of Labor Statistics, June 2020, https://www.bls.gov/cex/.
IMPORTANT INFORMATION FROM HANCOCK NATURAL RESOURCE GROUP
Investing involves risks, including the potential loss of principal. Financial markets are volatile and can fluctuate significantly in response to company, industry, political, regulatory, market, or economic developments. These risks are magnified for investments made in emerging markets. Currency risk is the risk that fluctuations in exchange rates may adversely affect the value of a portfolio’s investments.
The information provided does not take into account the suitability, investment objectives, financial situation, or particular needs of any specific person. You should consider the suitability of any type of investment for your circumstances and, if necessary, seek professional advice.
This material, intended for the exclusive use by the recipients who are allowed to receive this document under the applicable laws and regulations of the relevant jurisdictions, was produced by, and the opinions expressed are those of, Manulife Investment Management as of the date of this publication, and are subject to change based on market and other conditions. The information and/or analysis contained in this material has been compiled or arrived at from sources believed to be reliable, but Manulife Investment Management does not make any representation as to their accuracy, correctness, usefulness, or completeness and does not accept liability for any loss arising from the use of the information and/or analysis contained. The information in this material may contain projections or other forward-looking statements regarding future events, targets, management discipline, or other expectations, and is only as current as of the date indicated. The information in this document, including statements concerning financial market trends, is based on current market conditions, which will fluctuate and may be superseded by subsequent market events or for other reasons. Manulife Investment Management disclaims any responsibility to update such information.
Neither Manulife Investment Management or its affiliates, nor any of their directors, officers, or employees shall assume any liability or responsibility for any direct or indirect loss or damage or any other consequence of any person acting or not acting in reliance on the information contained herein. All overviews and commentary are intended to be general in nature and for current interest. While helpful, these overviews are no substitute for professional tax, investment, or legal advice. Clients should seek professional advice for their particular situation. Neither Manulife, Manulife Investment Management, nor any of their affiliates or representatives is providing tax, investment, or legal advice. Past performance does not guarantee future results.
This material was prepared solely for informational purposes, does not constitute a recommendation, professional advice, an offer, or an invitation by or on behalf of Manulife Investment Management to any person to buy or sell any security or adopt any investment strategy, and is no indication of trading intent in any fund or account managed by Manulife Investment Management. No investment strategy or risk management technique can guarantee returns or eliminate risk in any market environment. Diversification or asset allocation does not guarantee a profit or protect against a loss in any market. Unless otherwise specified, all data is sourced from Manulife Investment Management.
Manulife Investment Management
Manulife Investment Management is the global wealth and asset management segment of Manulife Financial Corporation. We draw on more than 150 years of financial stewardship to partner with clients across our institutional, retail, and retirement businesses globally. Our specialist approach to money management includes the highly differentiated strategies of our fixed-income, specialized equity, multi-asset solution, and private markets teams—along with access to specialized, unaffiliated asset managers from around the world through our multimanager model.
Hancock Natural Resource Group
Hancock Natural Resource Group, Inc. is a registered investment advisor and part of Manulife Investment Management’s Private Markets platform. We specialize in global farmland and timberland portfolio development and management on behalf of our investors worldwide. Our timber division manages approximately 6 million acres of timberland across the United States and in Canada, New Zealand, Australia, and Chile. Our agricultural investment group oversees approximately 300,000 acres of prime farmland in major agricultural regions of the United States and in Canada and Australia.
This material has not been reviewed by, and is not registered with, any securities or other regulatory authority, and may, where appropriate, be distributed by the following Manulife entities in their respective jurisdictions. Additional information about Manulife Investment Management may be found at manulifeim.com/institutional
Australia: Hancock Natural Resource Group Australasia Pty Limited., Manulife Investment Management (Hong Kong) Limited. Brazil: Hancock Asset Management Brasil Ltda. Canada: Manulife Investment Management Limited, Manulife Investment Management Distributors Inc., Manulife Investment Management (North America) Limited, Manulife Investment Management Private Markets (Canada) Corp. China: Manulife Overseas Investment Fund Management (Shanghai) Limited Company. European Economic Area and United Kingdom: Manulife Investment Management (Europe) Ltd., which is authorized and regulated by the Financial Conduct Authority, and Manulife Investment Management (Ireland) Ltd., which is authorized and regulated by the Central Bank of Ireland. Hong Kong: Manulife Investment Management (Hong Kong) Limited. Indonesia: PT Manulife Aset Manajemen Indonesia. Japan: Manulife Investment Management (Japan) Limited. Malaysia: Manulife Investment Management (M) Berhad (formerly known as Manulife Asset Management Services Berhad) 200801033087 (834424-U). Philippines: Manulife Asset Management and Trust Corporation. Singapore: Manulife Investment Management (Singapore) Pte. Ltd. (Company Registration No. 200709952G) South Korea: Manulife Investment Management (Hong Kong) Limited. Switzerland: Manulife IM (Switzerland) LLC. Taiwan: Manulife Investment Management (Taiwan) Co. Ltd. United States: John Hancock Investment Management LLC, Manulife Investment Management (US) LLC, Manulife Investment Management Private Markets (US) LLC, and Hancock Natural Resource Group, Inc. Vietnam: Manulife Investment Fund Management (Vietnam).