
This article will be featured in the next GAI Gazette, Volume 7, Issue 2, which will be distributed digitally in conjunction with the Global AgInvesting Europe event, which will be held virtually on December 7-8, 2020. Join us for this 11th annual event to gain valuable insight and learn best practices from the expert speaking faculty. See the agenda, and learn more and register.
By Daniel Serna, Hancock Natural Resource Group
Tree nuts have experienced robust demand growth over the past two decades, as they have increasingly been incorporated into diets across the globe. In the period 2004-2019, global tree nut production sustained a relatively steady expansion at a growth rate of 4.6 percent per year, but market growth has varied dramatically among the different tree nuts. Understanding the underlying demand/supply dynamics for the different major tree nut types is important to effectively evaluate opportunities and incorporate these important permanent crops into a diversified portfolio of agricultural properties.
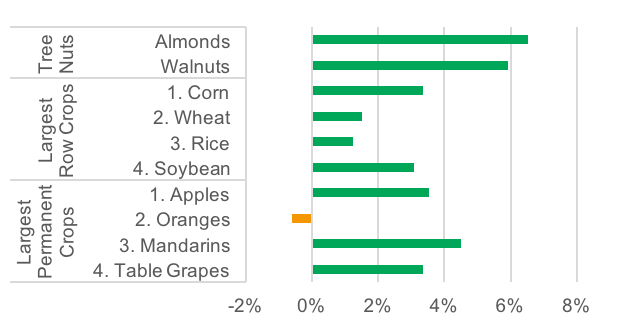
The nine major tree nuts – almonds, Brazil nuts, cashews, hazelnuts, macadamias, pine nuts, pecans, pistachios, and walnuts – have a combined annual production value of $36 billion,[1] which represents just 1 percent of the total global agriculture production value of about $3.7 trillion. Demand and resulting production of these crops has grown faster than most other major permanent and annual crops.[2] Almonds and walnuts grew nearly 6 percent annually during the period 2004-2018, while the leading row and non-nut permanent crops grew in the range of 3 to -4 percent annually.
Global Tree Nut Production Expands at a 4.6% CAGR 2004-2019
Chart 1: Global Tree Nut Production (Million Metric Tons, Shelled Basis, except Pistachios Inshell)[3]

Largest Tree Nuts Grow Faster than Largest Row or Permanent Crops
Chart 2: Global Production Growth of Crops by Production Volume, 2004-2018 CAGR[4]
Consumption
Tree nut demand has grown as consumer food choices have expanded with the development of larger retail stores, international trade, and most recently, through additional online grocery delivery. Globally, per capita consumption of tree nuts across the major varieties has steadily moved higher at a robust pace since 2004 as illustrated in Chart 3.
Almonds, Walnuts, Cashews and Pistachios Drive Increased Total Tree Nut Consumption
Chart 3: Global Per Capita Tree Nut Consumption (Annual Kilograms per Capita)[5]

Growth in tree nut consumption is occurring in both developed and emerging markets. While Europe remains the top consumption region (26 percent share), North America and Asia have been experiencing more pronounced increases in per-capita consumption and are closing the gap with Europe. North America and Asia now represent 23 percent and 20 percent, respectively, of global tree nut consumption.[6] Almonds are the most consumed nut by a wide margin (30 percent), followed by walnuts (20 percent), cashews (16 percent), pistachios (16 percent), hazelnuts (12 percent) and pecans (3 percent).[7] All other tree nuts combined comprise just 3 percent of total global tree nut consumption.[8]
Almonds Are the World’s Most Valuable Tree Nut Crop
Chart 4: Tree Nut Global Production Value, 2019/2020 Marketing Year ($ Billion)[9]

The continued expansion in tree nut demand persisted even as prices trended higher and during periods of global economic contractions. Tree nut consumption remained resilient during the global financial crisis in 2008 and 2009. Almonds, walnuts, cashews, pistachios, and macadamias experienced sustained growth since 2004, while hazelnuts and pecans have only recently moved higher. For the highest priced nuts, Brazil and pine nuts, consumption has been relatively flat.
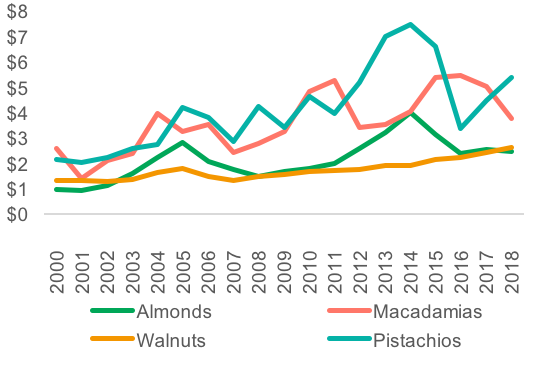
Tree Nut Prices Move Upward with Growing Demand
Chart 5: U.S. Farm Prices for Tree Nuts, Marketing Years Shelled Basis ($/lb.)[10]
Growth in demand across the different tree nuts has varied dramatically. A number of the nuts (Brazil nuts, pine nuts) have not experienced significant growth over the past 15 years, while others have shown moderate expansion (cashews, hazelnuts) and a few (almonds, pistachios, and walnuts) have experienced an extraordinary increase in their global market presence. Chart 6 illustrates the dominant contribution of almonds and walnuts to the overall growth in the global tree nut market over the past decade and half.
Global Tree Nut Volume Growth Accelerates
Chart 6: Cumulative 5-year Growth (Metric Tons)

Some factors that have contributed to the success of almonds, walnuts, and pistachios over the past 15 years include: the ability to scale up highly mechanized production and control costs of operations; strong marketing efforts aimed at promoting nuts as a healthy, plant-based protein to consumers; establishing industry product standards; and suitability of the nuts for use in a diversity of market segments. The range of food areas which almonds, walnuts, and pistachios are found includes ingredients in mass-market food products such as cereal, snacks, baked goods; home-use ingredient; and, stand-alone snack products.
Almonds and walnuts have both successfully leveraged their established position in key markets (U.S. and China) with strong nutritional evidence marketing their potential contribution to a healthy diet. The almond industry has been particularly successful in developing new products, such as almond milk, as a healthy substitute for dairy products. The Almond Board of California and producers of almond-based food products have broadened public awareness of the nut’s health benefits and reinforced their use as a named ingredient in foods such as snack bars, cereals, and restaurant dishes. Production at scale, and coordinated marketing efforts by large processors and almond grower organizations have supported the establishment of efficient distribution channels and reliable quality standards which have helped these nuts to reach dominant positions in the tree nut sector. Growth in walnut consumption over the past decade has been most prominent in China. China is the largest producer of walnuts, and the ability to tap into a domestic supply has underpinned walnuts’ increasing popularity in China over the past decade, coinciding with the country’s rapid rise in per-capita-income.
The shift to more modern larger-scale production of the major tree nuts over the past decade has also supported expansion of markets, providing more reliable availability, cost-efficient production and consistent quality. The expanded production and availability of almonds and walnuts is partially displacing more expensive and labor-intensive specialty nuts. For example, almonds and walnuts are now often used in pesto production that previously relied upon pine nuts. Food manufacturers have sought nuts with less expensive, more consistent supplies as preferred ingredients.
Because tree nuts feature a level of substitution potential, relative price levels and price stability are important determinants of their market shares. In addition, different harvest timing, perishability, and growing regions can lead to price variance within each marketing year. While consumption has grown steadily over the last two decades, demand growth has slowed during periods of elevated prices, indicating a degree of price elasticity that can trigger consumers and food manufacturers to consider substituting alternative nuts offering lower prices during periods of constrained availability or sharply rising prices for a particular variety of nut.
Supply
Producers of almonds and walnuts have been able to scale up capacity to establish a track record of dependable supply to support the extension of their market reach. The U.S. plays a major role in tree nut markets, ranking as the largest producer of almonds and pistachios, and the second largest producer of walnuts (following China) and pecans (behind Mexico). Tree nut production remains a niche specialty crop in U.S. agriculture, indicating room for growth in production area as tree nuts capture ground and water flows from other lower value, more water intensive crops. In the U.S., the farm value of tree nut production totaled $9.9 billion in 2019, 5 percent of total U.S. agricultural production.[11] Despite the small share of total crop production, tree nuts are recognized as one of the highest value crop types in dollars per acre terms. In the 2019 marketing year, the average gross revenue per acre of almonds was $5,249 per acre, compared to $603 per acre for corn.[12]
The U.S. Continues to Lead Global Tree Nut Production
Chart 7: Tree Nut Production Share, 2019/2020 Marketing Year [13]

Recent Uptick in Global Tree Nut Area Points to Future Supply Growth
Chart 8: Global Harvested Area (Hectares)[14]

Noticeable shifts in global supply have occurred recently, and based on current plantings, are expected to continue. A strong increase in Southern Hemisphere production is making tree nut markets less seasonal, with southern hemisphere harvests coming into the marketplace in late Q1 and early Q2, counter-seasonal to the U.S. and other northern hemisphere producers in the second half of the calendar year. Almonds in Australia, macadamias and pecans in South Africa, and walnuts in Chile are experiencing investment in expanded planted area. In the marketing years ending in 2019, Australia surpassed Spain to become the world’s second-largest almond producer, South Africa edged past Australia to become the largest macadamia producer, and Mexico exceeded the U.S. to become the largest pecan producer.[15]
While there are limits to the latitudes, climate, soils, and water resources required for optimal production, we believe supply will continue to expand if prices remain at levels providing attractive returns and encouraging additional development. While each nut’s supply and demand can differ annually, we believe that understanding the full scope of long-term trends is important for analyzing the economic outlook of each crop. Managing precious water resources through orchard design and management, and policy and market mechanisms, will be important in ensuring sustainable water supplies for agriculture and tree nut production.
Looking forward
Continued expansion in tree nut production will be driven by consumption trends that have been firmly established over the past decade. The first trend is the increased role of tree nuts in consumer diets globally, particularly in those regions where per capita consumption of key nuts remains low relative to the global average. As India and China continue to increase annual per capita consumption of tree nuts from their current levels of 0.92 kg and 0.74 kg respectively, they still have a long way before reaching levels near the U.S. (7.1kg).[16] The second trend is that tree nuts continue to fit with a broad shift for alternative and plant-based proteins, which are in the process of expanding from primarily secondary ingredients to increased direct consumption as snacks, and to center plate food status, as illustrated by the recent success of alternative plant-based protein products.
Tree Nut Consumption Has Strong Growth Potential
Chart 9: 2018 Per Capita Tree Nut Consumption (Kg/Capita/Year)[17]

The ongoing expansion of tree nut supply and the geographic diversification of supply regions will help maintain the reliable availability required by large-scale food manufacturers. An expanding, geographically more diverse supply base will also help moderate tree nut price volatility, supporting further market growth. The market dynamics of tree nut demand and supply have evolved at a rapid pace and are expected to continue to adapt with changing consumer preferences and geographic expansion of production regions. As change continues, tree nuts are high-value, nutrient-rich foods that will continue to generate globally diverse opportunities for investors.
ABOUT THE AUTHOR
 Daniel Serna is associate director, senior agricultural economist for Hancock Natural Resources Group (HNRG) and is responsible for leading global economic market research for the farmland investment business. In addition, he is directly involved with investment strategy and communicating farmland investment characteristics to current and prospective investors. In this role, he produces market outlooks and price forecasts for major crops produced on client properties. Before joining HNRG, Serna was an associate director with MetLife Agricultural Finance, where he originated farm and ranch real estate loans, including business development, credit analysis and farmland valuations. Prior to MetLife, Serna was a business analyst with Agri-Mark/Cabot, a vertically integrated cooperative of 1,000 dairy farmers, where he was directly involved in commodities futures and options. Serna holds a BA in Economics from Yale University and an MBA from Harvard Business School.
ENDNOTES
[1] International Nut and Dried Fruit Council, 2019 Statistical Yearbook, https://www.nutfruit.org/industry/technical-resources?category=statistical-yearbooks. All dollar amounts referenced in this piece are U.S. Dollars.
[2] UN Food and Agriculture Organization, http://www.fao.org/faostat/en/#data/QV/metadata
[3] International Nut and Dried Fruit Council, 2019 Statistical Yearbook.
[4] USDA Production, Supply and Distribution Online, accessed September 2020, https://apps.fas.usda.gov/psdonline/app/index.html#/app/home
[5] International Nut and Dried Fruit Council. 2019 Statistical Yearbook.
[6] International Nut and Dried Fruit Council, 2019 Statistical Yearbook, 2018 marketing year consumption.
[7] Ibid.
[8] Ibid.
[9] International Nut and Dried Fruit Council. 2019 Statistical Yearbook.
[10] USDA Economic Research Service, Fruit and Tree Nut Yearbook 2019.
[11] USDA Economic Research Service, Farm Income and Wealth Statistics, https://www.ers.usda.gov/data-products/farm-income-and-wealth-statistics/data-files-us-and-state-level-farm-income-and-wealth-statistics/
[12] USDA WASDE September 2020 https://www.usda.gov/oce/commodity/wasde/wasde0920.pdf, USDA Noncitrus Fruits and Nuts May 2020 https://downloads.usda.library.cornell.edu/usda-esmis/files/zs25x846c/0g3551329/qj72pt50f/ncit0520.pdf
[13] International Nut and Dried Fruit Council, 2019 Statistical Yearbook.
[14] UN FAOSTAT, accessed September 2020, http://www.fao.org/faostat/en/#home
[15] International Nut and Dried Fruit Council, 2019 Statistical Yearbook.
[16] Ibid.
[17] International Nut and Dried Fruit Council, 2019 Statistical Yearbook, 2018 marketing year consumption.
IMPORTANT INFORMATION FROM HANCOCK
Investing involves risks, including the potential loss of principal. Financial markets are volatile and can fluctuate significantly in response to company, industry, political, regulatory, market, or economic developments. These risks are magnified for investments made in emerging markets. Currency risk is the risk that fluctuations in exchange rates may adversely affect the value of a portfolio’s investments.
The information provided does not take into account the suitability, investment objectives, financial situation, or particular needs of any specific person. You should consider the suitability of any type of investment for your circumstances and, if necessary, seek professional advice.
This material, intended for the exclusive use by the recipients who are allowable to receive this document under the applicable laws and regulations of the relevant jurisdictions, was produced by, and the opinions expressed are those of, Manulife Investment Management as of the date of this publication, and are subject to change based on market and other conditions. The information and/or analysis contained in this material have been compiled or arrived at from sources believed to be reliable, but Manulife Investment Management does not make any representation as to their accuracy, correctness, usefulness, or completeness and does not accept liability for any loss arising from the use of the information and/or analysis contained. The information in this material may contain projections or other forward-looking statements regarding future events, targets, management discipline, or other expectations, and is only as current as of the date indicated. The information in this document, including statements concerning financial market trends, are based on current market conditions, which will fluctuate and may be superseded by subsequent market events or for other reasons. Manulife Investment Management disclaims any responsibility to update such information.
Neither Manulife Investment Management or its affiliates, nor any of their directors, officers or employees shall assume any liability or responsibility for any direct or indirect loss or damage or any other consequence of any person acting or not acting in reliance on the information contained herein. All overviews and commentary are intended to be general in nature and for current interest. While helpful, these overviews are no substitute for professional tax, investment or legal advice. Clients should seek professional advice for their particular situation. Neither Manulife, Manulife Investment Management, nor any of their affiliates or representatives is providing tax, investment or legal advice. Past performance does not guarantee future results. This material was prepared solely for informational purposes, does not constitute a recommendation, professional advice, an offer or an invitation by or on behalf of Manulife Investment Management to any person to buy or sell any security or adopt any investment strategy, and is no indication of trading intent in any fund or account managed by Manulife Investment Management. No investment strategy or risk management technique can guarantee returns or eliminate risk in any market environment. Diversification or asset allocation does not guarantee a profit nor protect against loss in any market. Unless otherwise specified, all data is sourced from Manulife Investment Management.
Manulife Investment Management
Manulife Investment Management is the global wealth and asset management segment of Manulife Financial Corporation. We draw on more than 150 years of financial stewardship to partner with clients across our institutional, retail, and retirement businesses globally. Our specialist approach to money management includes the highly differentiated strategies of our fixed-income, specialized equity, multi-asset solutions, and private markets teams—along with access to specialized, unaffiliated asset managers from around the world through our multimanager model.
Hancock Natural Resource Group
Hancock Natural Resource Group, Inc. is a registered investment adviser and part of Manulife Investment Management’s Private Markets platform. We specialize in global farmland and timberland portfolio development and management on behalf of our investors worldwide. Our timber division manages approximately 6 million acres of timberland across the United States and in Canada, New Zealand, Australia, and Chile. Our agricultural investment group oversees approximately 300,000 acres of prime farmland in major agricultural regions of the United States and in Canada and Australia.
These materials have not been reviewed by, are not registered with any securities or other regulatory authority, and may, where appropriate, be distributed by the following Manulife entities in their respective jurisdictions. Additional information about Manulife Investment Management may be found at www.manulifeim.com/institutional
Australia: Hancock Natural Resource Group Australasia Pty Limited., Manulife Investment Management (Hong Kong) Limited. Brazil: Hancock Asset Management Brasil Ltda. Canada: Manulife Investment Management Limited, Manulife Investment Management Distributors Inc., Manulife Investment Management (North America) Limited, Manulife Investment Management Private Markets (Canada) Corp. China: Manulife Overseas Investment Fund Management (Shanghai) Limited Company. European Economic Area and United Kingdom: Manulife Investment Management (Europe) Ltd. which is authorised and regulated by the Financial Conduct Authority, Manulife Investment Management (Ireland) Ltd. which is authorised and regulated by the Central Bank of Ireland Hong Kong: Manulife Investment Management (Hong Kong) Limited. Indonesia: PT Manulife Aset Manajemen Indonesia. Japan: Manulife Investment Management (Japan) Limited. Malaysia: Manulife Investment Management (M) Berhad (formerly known as Manulife Asset Management Services Berhad) 200801033087 (834424-U) Philippines: Manulife Asset Management and Trust Corporation. Singapore: Manulife Investment Management (Singapore) Pte. Ltd. (Company Registration No. 200709952G) South Korea: Manulife Investment Management (Hong Kong) Limited. Switzerland: Manulife IM (Switzerland) LLC. Taiwan: Manulife Investment Management (Taiwan) Co. Ltd. United States: John Hancock Investment Management LLC, Manulife Investment Management (US) LLC, Manulife Investment Management Private Markets (US) LLC and Hancock Natural Resource Group, Inc. Vietnam: Manulife Investment Fund Management (Vietnam) Company Limited.
Manulife Investment Management, the Stylized M Design, and Manulife Investment Management & Stylized M Design are trademarks of The Manufacturers Life Insurance Company and are used by it, and by its affiliates under license.
523591