
This article will be featured along with other articles addressing investment opportunities in Australasian agriculture in Volume 5, Issue 3 of the GAI Gazette which will be distributed in conjunction with Global AgInvesting Asia 2018, held in Tokyo on 2-3 October 2018. Join us in Tokyo to hear valuable insights and best practices for investment strategy from the expert speaking faculty. Learn more and register.
By Michael DeSa, AGD Consulting
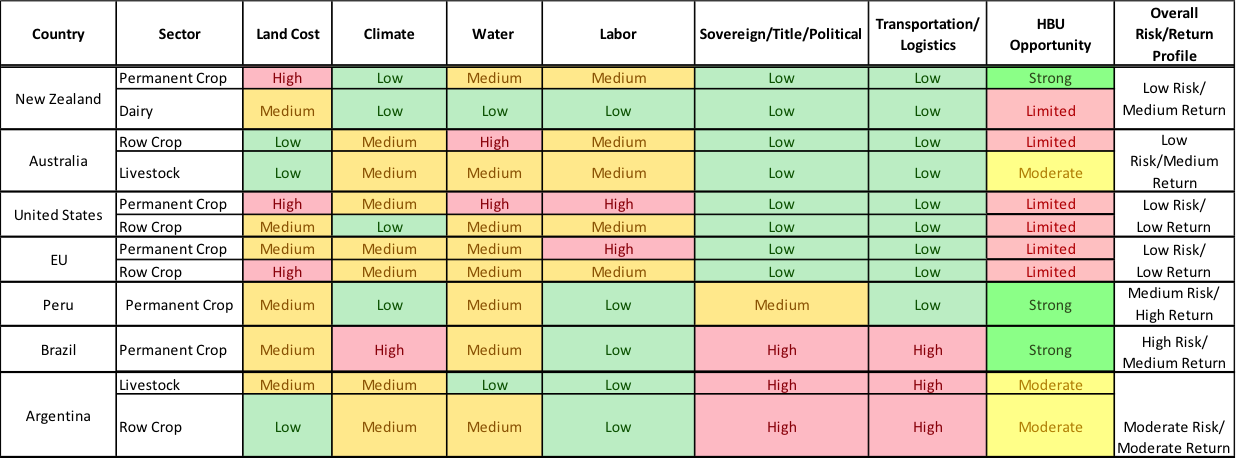
Limited government intervention, an ability to produce exportable surpluses, and low production costs have helped create goldilocks-like agricultural opportunities in Australia and New Zealand. Little to no uptick in political risk relative to other OECD countries and limited access to domestic capital creating arbitrage opportunities have helped form the pillars of a sound investment foundation. New Zealand is a transformative opportunity in the niche, high-yield specialty permanent crop space where value is extracted from new IP-protected varietals. Australia is an evergreen prospect in the farmland and animal protein sectors deriving its value from scalability and efficient operational and water management practices. Further priming the region for future efficiencies are advantages in logistics, compared to LatAm, the U.S., and Europe, as well as an ag culture focused on improving productivity through an active precision ag effort.
While challenges do exist, such as limited scalability in New Zealand, an over-dependency on a major regional trade partner, and water security in Australia, these risks can be managed through selective strategies and diversity within the sector. Barriers to foreign investment remain directed primarily against China and are relatively simple to overcome compared to other geographies. This article evaluates both countries’ relative value to other markets, investment opportunities, risk factors, and future outlook.
Strong Relative Value
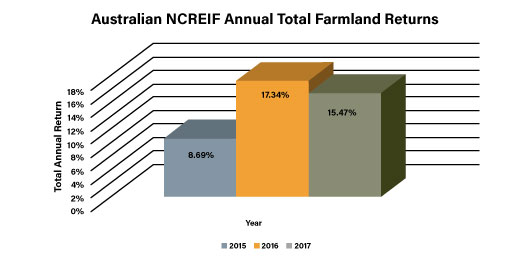
The establishment of a National Council of Real Estate Investment Fiduciaries (NCREIF) Farmland Index in Australia indicates a favorable long-term outlook for Australian farmland. The index was established in 2015, and while data points are still limited (12 quarterly data points and only 48 farms in the index), total annual returns for the last three years appear strong.
A direct comparison to the U.S. NCREIF index is difficult because of the difference in the quantity of data sets, differing asset appraisal timelines, and a lack of longevity in the Australian index. A re-index of the Australian and U.S. NCREIF Indices shows Australian farmland outperforming U.S. farmland with 10.5 percent higher cumulative total returns over a two-year period.1
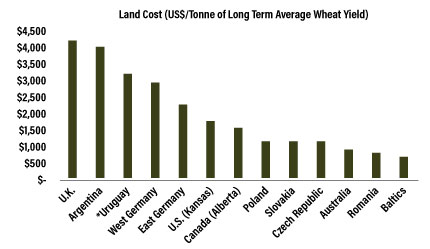
A direct comparison of farmland prices in Australia/New Zealand to other OECD countries on a cost per hectare basis is not conclusive due to wide differences in farmland productivity and land price valuations, and therefore, land cost per unit of production is a more meaningful comparison metric. The utilization of a production-based benchmark allows investors to compare land values using different production characteristics. Using the long-term average for wheat yield as an example, the graph below illustrates relatively low land cost per unit of production for Australia when compared to other developed/OECD countries. Investing in farmland with low land cost per unit of production can allow an investor to realize greater capital gains through the application of more efficient management, farming practices, new technology, and higher operating returns. It’s important to note, however, that this metric does not take into account the logistical costs of getting the product from the farm gate to the market.
Agricultural government subsidies from a variety of developed and OECD countries were also compared against those in Australia/New Zealand. Lower, or non-existent subsidies, can force producers to be more efficient and yield-oriented if they know there is no government-supported safety net. This also prevents the unexpected removal of subsidies from disrupting an entire sector. The Producer Support Estimate (PSE) shows the lowest percentage of government subsidy funds provided to New Zealand and Australian farmers (0.9 percent and 2.0 percent, respectively) when compared to 11 other OECD countries.2
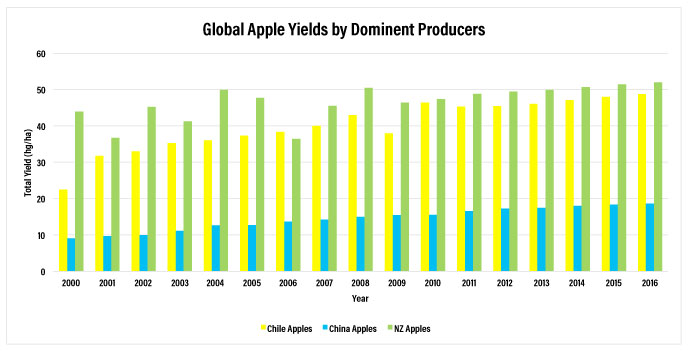
The ability of a country to produce a surplus of an exportable product is another important metric for evaluating competitiveness in the global market place. A large exportable surplus, often generated through higher yields and larger market share, indicates a country’s ability to supply a lower cost product to the global market. From 2005 to 2015, New Zealand went from accounting for 39 percent of the total global kiwifruit export market to accounting for over 50 percent in 2015. The nearest competitors, Italy and Chile, have remained relatively flat during the same period. Italy began at 24.4 percent and ended at 23.6 percent, while Chile began at 9.4 percent and ended at 11.6 percent over the same time period.3 The graph below highlights New Zealand’s total kiwifruit and apple yields compared to other global producers; illustrating their ability to create exportable surpluses.

Australian and New Zealand agriculture present a strong relative value compared to other developed agricultural markets. Appreciating farmland returns, low costs per unit of production, low government subsidies, and the ability to create large export surpluses are all positive indicators of the region’s agricultural investment potential.
Opportunities
A structural shift in ownership of farmland in Australia and New Zealand is creating a new demand for capital. Consolidation of smaller farms by larger operations is permitting older farmers to retire. This changing of hands is creating an increasing demand for capital in order to achieve critical mass and operational efficiencies.4 This section will highlight specific opportunities and trends in the agricultural markets as a result of these shifting conditions.
Australia
Agriculture has been one of the pillars supporting Australia’s economy, accounting for 12 percent of the nation’s GDP5, with the majority of all agricultural commodities produced in Australia sold to international markets. Due to the availability of arable land, investments in farmland assets and large-scale livestock operations are ideally suited.
Strong export markets and limited growth in global lamb production is expected to continue to drive strong prices for Australia’s lamb industry for the next several years. From 2009 to 2016, the value of Australia’s overall sheep meat export market grew by nearly 50 percent (in real terms), from US$1.5 billion to US$2.3 billion6, with lamb meat exports accounting for almost three-quarters of total sheep meat exports from Australia. Demand is expected to remain high, driven primarily by income growth in China and a strong market demand from the Middle East and the United States. Lamb export volumes to the U.S. grew by two percent in 2017 following an average annual growth rate for sheep meat of 11 percent over the previous five years.7 Exports to China grew 41 percent in 2017 alone. Supply is expected to remain muted as strong lamb prices create incentives for producers to limit flock growth in the short term. Strong demand from diversified markets and muted supply growth will continue to be positive for influencers for Australian lamb prices. These supply and demand conditions, coupled with the availability of scale and expert farm management organizations/practices in Australia, make for an attractive investment opportunity.
The current negative sentiment of Australian farmland by their own superannuation (SUPERS) funds is also creating an opportunity for outside investors to capitalize on rising farmland returns in the region. While Canadian, U.S. and British pension funds have been willing investors in Australian farmland for years, Australian SUPERS historically have been adverse to real assets, viewing farmland as a new asset class with varied returns. AustralianSuper, Australia’s largest non-profit SUPER, plus of number of other industry funds, quit the Sustainable Agriculture Fund (SAF) last year after years as key investors.8 The decision to sell by AgCap, the fund’s manager, was unanimous and came more than a year ago, before the fund announced a one-year total return of 10.6 percent (after fees) for the year 2016. AgCap’s investors cited mediocre returns and a lengthy time horizon (seven years). Whether this is just a missed opportunity by SAF investors or an outward sign of a skeptical sentiment towards farmland as an asset class on the part of the Australians, it has created an opportunity for international institutional investors to broaden their exposure to an asset class that is fundamentally strong.
New Zealand
This same structural shift in ownership of farmland is playing out in New Zealand, creating a new demand for capital in the permanent crop space. New kiwifruit, for example, were hit relatively hard by a 2010 Pseudomonas Syringae Actinidiae (PSA) outbreak, destroying a large portion of the countries’ green and gold kiwifruit supply. This forced many commercial growers to reexamine kiwifruit varieties and their resiliency to PSA. Zespri, the number one global exporter and number three global producer of kiwifruit9, developed a proprietary SunGold varietal, a G3 PSA bacteria-resistant cultivar, in response to the outbreak.
Zespri owns the license to this new G3 variety and plans to release 3,750 ha of SunGold licenses over the next five years, of which 250 hectares will be organic SunGold. While these licenses are available internationally, it should be noted that given New Zealand’s ideal growing climate, counter-seasonality to NORAM/Europe and overall kiwifruit market share, these G3 premiums will likely be the highest in New Zealand. Since November 2014, specialty farm management company, Craigmore Sustainables, has been transforming nearly 40 hectares of green kiwifruit orchards into the G3 variety with licenses purchased from Zespri. While the holding period for the Craigmore orchards has been short, the IRR achieved to date, Q1 2017 – 2018, has averaged 29.2 percent.
Industry consolidation, emerging IP-controlled varieties, and strong export market surplus capacity are creating similar opportunities in New Zealand’s apple market. New Zealand apples are the country’s second leading produce export, accounting for 25 percent of total produce exports, and the country is the number three apple exporter in the Southern Hemisphere.10 New Zealand has a strong record of new variety development – the Gala and Braeburn varieties now account for one-sixth of trees globally (outside China). When compared against key peer countries, New Zealand was the top average apple yielding country in 2014, in front of Chile and Italy with a growing market share percentage. From 2012 to 2015, as New Zealand began to bring new apple varietals online, their market share grew from 4.1 percent to 6.3 percent. China, the leader in global apple export value, lost market share during the same period from 15.5 percent to 15.0 percent.11
The new Dazzle apple variety was launched in December 2016 by Fruitcraft after being licensed the worldwide rights by Prevar Ltd.12 This was one of the biggest apple variety launches since Royal Gala decades ago. Fruitcraft is forecasting one million cartons will be exported from New Zealand by 2028, which could make it one of the country’s most popular apple varieties.
Investment strategies should be focused on transformative and new varietal opportunities within the New Zealand kiwifruit and apple sectors while prospects are best found in Australian farmland and certain animal protein sectors due to their scalability and expert land-use experience and practices. Further adoption of precision ag technology by both countries will continue to enhance on-farm productivity, leading to higher yields, lower production costs, and increased profitability.
Risk Factors
As with any investment opportunity, the risks need to be carefully measured against potential returns in order to meet specific investment criteria. The prospects for investing in scalability in New Zealand are limited as expansion of area devoted to key commodities is fixed. Therefore, opportunities for increasing scale in New Zealand will likely come in the form of land conversion, while Australia will center on improved efficiencies generated through technology adoption and consolidation. Increased scale in one crop type will likely come at the expense of another, as land is converted to more profitable products. Particularly in New Zealand, limited arable land constraints could lead to a lack of scale outside key export products, particularly in the permanent crop sectors.
The largest export markets for both New Zealand and Australia are predominantly Asian countries, in particular, China. Over 20 percent of New Zealand’s kiwifruit and apples, as well as 20-plus percent of Australia’s overall agricultural products, are destined for China. This heavy reliance on a single trade partner can create an overexposure risk. High levels of Chinese debt continue to add to the uncertainty in the country’s long-term economic strength. With China such a large importer of Australian and New Zealand agricultural commodities, their increasing debt levels13, and other economic challenges bring a sense of uncertainty to their long-term growth potential. While diversity within the Australian livestock markets along with a growing demand from the Chinese middle class both serve as counter-balances, investors need to weigh this potential risk against proposed gains.
Many of the opportunities in Australia center on farmland assets, therefore, the regulations of owning Australian farmland as a foreign investor need to be considered. Under the Foreign Acquisitions and Takeover Acts 1975 (FATA), investment in agricultural land by foreign persons requires prior approval by Australia’s Foreign Investment Review Board (FIRB) where: the investor is a foreign government; or with non-government investors (other than Chile, New Zealand, Thailand, and the U.S.), the cumulative value of the foreign investor’s agricultural land holdings in Australia will be greater than AUD$15MM.14
The FIRB has a significant role in deciding to approve or disapprove a transaction, and with changes to these rules over the past two years and inconsistent determinations, this could lead to an increased sense of uncertainty among foreign investors. In 2016, Australia’s Federal Treasurer granted foreign owners of Cubbie Station (Chinese textile giant Shandong Ruyi) an extra three years to comply with the original conditions of the sale; to sell down its stake from 80 percent to 51 percent.15 Many Australians felt this decision to give Shandong more time was not in the best interest of the country and fought to stop it. This verdict came on the heels of another decision by the treasurer to stop two previous bids by other Chinese companies to buy Australia’s largest cattle company, S. Kidman and Co, citing it was “contrary to the national interest”. These decisions were seen by many as an inconsistent approach by the Australian government in determining foreign investment approval and could serve to bolster a reluctance by Australians and the international community to invest in farmland assets.
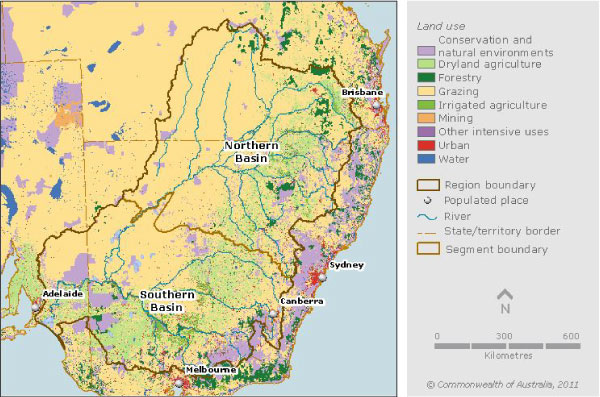
Finally, water rights in Australia don’t guarantee water availability. Australian farms used less water in 2015/16 than in the previous year; partly because there was less water to use.16 A generally dryer year reduced water allocation as well as water availability in on-farm dams and tanks. The biggest decrease was in New South Wales (NSW), where the number of irrigating businesses dropped 21 percent. The Agricultural Census attributed this decrease to a decision by more NSW irrigators in the Murray-Darling water network to trade their water allocation, instead of using it to grow a crop. The Murray-Darling Basin accounted for 57 percent of all water used for irrigation in 2015/16.17 This high dependency on the Murray-Darling water network exposes farmland investors to high levels of risk concentration. As rules and water values vary widely between rivers and regions, the key is to understand this variability, quantify it, then value it.
The limited opportunities for scale, heavy reliance on China as a major trading partner, uncertain foreign investor regulations, and challenging water situation are all risk factors that need to be considered.
Future Outlook
Investors should strive for a balanced approach between creating efficiencies and scale in Australian farmland while capitalizing on niche, high-yielding permanent crops in New Zealand. Consolidation at all levels of the value chain will continue to drive overall efficiency and management. The growing middle class demand from the Asia-Pacific region will be a positive trend for the region’s exporters, but will need to be a measured approach from investors due Australia/New Zealand’s high dependency on a major trading partner. Both countries will continue to adopt technology-enabled alternatives to increase yields and manage water challenges.
It is realistic to assume agriculture is moving into a phase where productivity growth will be driven by the more efficient use of existing land, inputs, and water. Therefore, future return potential will rest with technology-enabled improvements in per-hectare production, reductions in unit production costs, and creative solutions to waste management. Growth will need to be supported by effective R&D and the development of new pathways for the commercialization of new varietals. This will all need to occur against a background of a changing climate and varying input costs.
ABOUT THE AUTHOR
Michael DeSa is the founder/managing director of AGD Consulting, a U.S.-based, strategic advisory and business development firm servicing the agricultural and resource sectors in emerging and OECD markets. His agricultural engineering background, 10- years of leadership and project management experience with the U.S. Marine Corps, and extensive travels and investment experience in emerging market countries make him uniquely qualified to counsel companies and investors throughout the region. Services include farmland and agribusiness due diligence, project origination, market assessment, and competitive analysis for precision ag technology and international project management. DeSa can be reached at michael@desaconsultingllc.com.
# # #
DISCLAIMER: All views, data, opinions and declarations expressed are solely those of the author(s) and not of Global AgInvesting, GAI News, GAI Gazette, or parent company HighQuest Group.
1. 2016 and 2017 Australian and United States National Council of Real Estate Investment Fiduciaries (NCREIF) Indexes↩
2. Organization for Economic Co-operation and Development (OECD). “Producer and Consumer Support Estimates database.” 2016. http://www.oecd.org/tad/agricultural-policies/producerandconsumersupportestimatesdatabase.htm↩
3. Coriolis, New Zealand Ministry of Business Innovation & Employment, New Zealand Trade & Enterprise and Ministry of Primary Industries. “The Investor’s Guide to the New Zealand Produce Industry 2017 – Part of the New Zealand Food & Beverage Information Project, FINAL REPORT.” (v2.01; June 2017): 6. Web. 21 March 2018↩
4. FarmInvest Australia. Invest in Australian Agriculture. 2015. http://farminvestaustralia.com.au/invest-in-australian-agriculture/↩
5. Chepkemoi, Joyce. World Atlas – Top 10 Agricultural Exports of Australia. 25 April 2017. https://www.worldatlas.com/articles/top-10-agricultural-exports-of-australia.html↩
6. Food Innovation Australia Limited, “Australia’s recent meat export performance.”10 August 2017. https://fial.com.au/australia-meat-export-performance↩
7. RaboResearch Food & Agribusiness. “Rabbobank Australia Agribusiness Outlook 2018.” 16-17. Web. 20 April 2018.↩
8. Hemphill, Peter. The Weekly Times. “Farming investment: Australian superannuation funds pulling out support.” 23 March 2017. https://www.weeklytimesnow.com.au/agriblusiness/decisionag/farming-investment-australian-superannuation-funds-pulling-out-support/news-story/31a1986bd6cedcbacce9f8669b75160e?nk=583a6e0595cf590e3d47fba9f5e7e20b-1520876030↩
9. Coriolis, New Zealand Ministry of Business Innovation & Employment, New Zealand Trade & Enterprise and Ministry of Primary Industries. “The Investor’s Guide to the New Zealand Produce Industry 2017 – Part of the New Zealand Food & Beverage Information Project, FINAL REPORT.” (v2.01;June 2017): 44. Web. 7-22 March 2018↩
10. Ibid. 44. Web. 26 March 2018↩
11. Ibid. 36. Web. 13 April 2018.↩
12. O’Connell, Tim. NZFarmer.co.nz. “Dazzle apple variety launched after twenty-year development.” 21 December 2016. https://www.stuff.co.nz/business/farming/87775089/dazzle-apple-variety-launched-after-twentyyear-development↩
13. Ibid.↩
14. Johns, Steve. Lexology. “Changes to FIRB laws make it harder for foreign investors to buy agricultural land in Australia.” 12 February 2018. https://www.lexology.com/library/detail.aspx?g=f689b841-3eea-4cb2-8a67-e3793ce688b7↩
15. ABC Rural News. “Cubbie Station Ownership Changes.” 21 June 2016. http://www.abc.net.au/news/rural/rural-news/2016-06-21/cubbie-ownership-changes/7517058↩
16. Vidot, Anna. ABC Rural News. “Farmers getting older as latest survey reveals average age is 56.” 6 July 2017. http://www.abc.net.au/news/rural/2017-07-07/whos-farming-australia-abs-agricultural-census-2015-16/8686750↩
17. Ibid.↩