
Contributed content from Weiyi Zhang, Ph.D., Senior Agricultural Economist, Manulife Investment Management
Farmland is often considered to be a real asset class that provides investors with attractive risk-adjusted returns, portfolio diversification benefits, and access to natural resources with sustainable management practices in addition to positive performance during inflationary periods. In today’s unsettled and highly dynamic macroeconomic environment, especially as inflation remains elevated, investors look to farmland for stable returns and protection against inflationary pressure.
U.S. farmland fared well during inflation-pressed 2021 and 2022
Farmland’s inflation-hedging potential has been substantiated in the past two years by its ability to produce positive inflation-adjusted real returns as inflation soared. Annual inflation in the United States averaged 6.8 percent over the past two years, quadrupling the previous 10-year average inflation rate of 1.7 percent.1 Chart 1 shows that U.S. farmland, as represented by the National Council of Real Estate Investment Fiduciaries (NCREIF) Farmland Index, generated positive and increasing total returns during 2021 and 2022. In comparison, other asset classes saw considerable performance swings during the same period, generating negative nominal returns in 2022, a year of tightened monetary policies and elevated inflation. Resilient and strong performance by farmland investments over the past two turbulent years demonstrates the case for the asset class’s portfolio diversification and inflation-hedging benefits.
Chart 1. Farmland-generated stable and positive returns in the recent high-inflation rate environment
Nominal annual total returns for select asset classes in 2021 and 2022
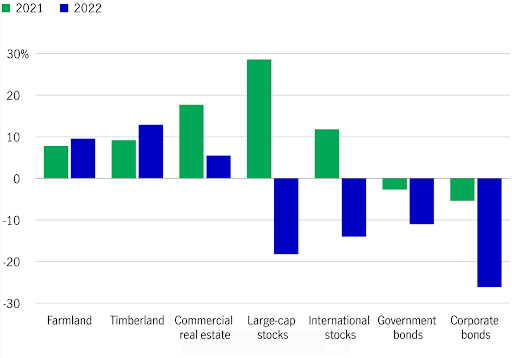
Source: NCREIF, Macrobond, as of December 2022. Returns for farmland, timberland, and commercial real estate refer to the total returns on NCREIF indexes for the respective asset classes. Large-cap stocks refer to the S&P 500 Index. International stocks refer to the MSCI EAFE Mid and Large Cap Indexes. Government and corporate bonds refer to IA SBBI® US LT Govt TR USD and IA SBBI® US LT Corp TR USDs from Ibbotson Associates. It is not possible to invest directly in an index.
Correlation between farmland returns and inflation remained overwhelmingly positive, providing protection against inflation pressure
The correlation between investment returns and inflation is a key indicator of the potential inflation- hedging capability of an asset class where a positive correlation with inflation indicates that investment returns may rise as inflation surges. The rolling analysis in Chart 2 shows that the correlation between NCREIF Farmland Index returns and U.S. inflation has been dynamic and overwhelmingly positive and readily apparent during the late 1990s, the entire first decade of the 2000s, mid-2010s, and early 2020s. The most recent positive rolling correlation (five-year rolling periods ended 2020-2022) reinforces farmland’s apparent inflation-hedging capacity. Nevertheless, the correlation pattern hasn’t been consistently positive and has turned negative during a few brief periods over the last 27 years.
Chart 2. Overwhelmingly positive correlation between farmland returns and inflation demonstrates inflation-hedging potential
Five-year rolling correlation between nominal returns on the NCREIF Farmland Index and U.S. CPI inflation (1991–2022)
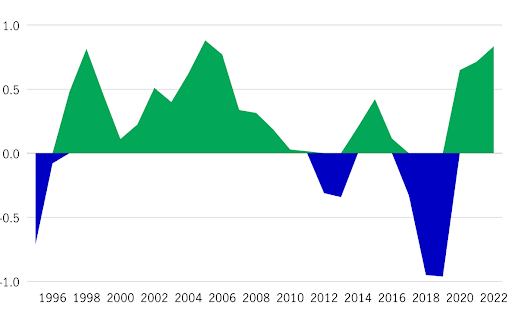
Source: NCREIF, as of December 2022; U.S. Bureau of Labor Statistics, as of February 2023.
The two instances of negative rolling correlations (2011–2013 and 2017–2019) can be attributed to the different directions taken by farmland returns and inflation rates. The economic recovery after the Great Financial Crisis (GFC) was considered lackluster, with only modest economic growth and inflation below the U.S. Federal Reserve’s desired 2 percent target2 during five of the first seven post-GFC years. Meanwhile, farmland returns improved significantly during that period, especially from 2011 to 2015, when the NCREIF Farmland Index posted double-digit percentage annual returns for five consecutive years. The difference between the robust performance of farmland and a modest and extended economic recovery contributed to the sporadic negative correlations; therefore, from an investor’s perspective, a negative correlation may be interpreted as the asset class’s ability to outperform otherwise moribund growth in the broader economy during a period of below-target inflation.
Short-term production cost pressure poised to ease, while long-term challenges persist
Farmland’s inflation-hedging features can be attributed in part to its finite availability and the food products it produces: as the economy grows, demand for agricultural products increases, driving up farm product prices and helping to mitigate input cost inflation. Like many other aspects of the economy, agricultural production faced heightened cost pressures in the aftermath of the global pandemic. U.S. inflation surpassed 2.5 percent in March 2021 for the first time since the beginning of the pandemic. Since then, major agricultural production cost categories have experienced marked increases and, as a result, total production expenses increased 19 percent for U.S. farmers from 2021 to 20223; responding to increased demand, supply constraints, and increased input costs, prices of farm products also increased. From March 2021 to December 2022, the overall price levels of farm products increased more than 40 percent, represented by the changes in the Producer Price Indexes for farm products, partially offsetting rising cost pressures. The ability of farm goods prices to provide relief from higher production costs encouraged farmers to continue growing crops, with the combination of higher prices and stable output leading to a record-setting total U.S. farm revenue in 2022, despite multi-decade high inflation rates.
Chart 3. Material inputs experienced volatile cost swings, while long-term cost challenges remain
Producer Price Indexes for key agricultural cost items, March 2021 to their respective peak levels and since reaching their respective peak levels
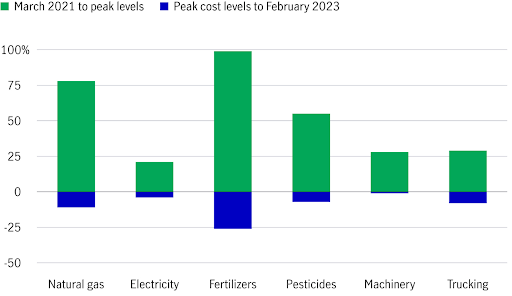
Source: U.S. Bureau of Labor Statistics, Production Price Indices, as of February 2023. Period in which peak levels were reached: natural gas, September 2022; electricity, January 2023; fertilizers, April 2022; pesticides, August 2022, machinery, October 2022; trucking, May 2022.
Inflation affects varied by crop type due to cost structure differences
The impact of input cost inflation differed across crop types due to the varied structures of production cost components. As shown in Chart 3, material inputs (variable costs), such as fuel and chemicals, experienced more pronounced cost increases than long-term capital costs (fixed costs), such as machinery and equipment, during the 2021/2022 inflationary period. Therefore, the operating cost impact varied considerably across crop types; for example, the costs of material inputs account for more than 60 percent of total operating costs for row crops, such as corn and soybeans.4 While these material inputs saw rapid and sizable increases in 2021/2022, their price levels have also since declined more markedly from peak levels (Chart 3). Fertilizer costs, for instance, have declined nearly 40 percent since peaking in April 2022. On the other hand, production costs for permanent crops tend to be skewed toward cost categories that have experienced more structural and long-term increases; for example, about 75 percent of commercial apple production’s operating expenses are associated with labor and services.5 While costs in these categories exhibited less volatility in the recent inflationary period than material inputs, they’ve steadily trended higher at a more consistent pace and aren’t expected to see meaningful moderation in the future. To manage these long-term cost pressures, efficient operations and economies of scale in asset management become key to addressing these structural challenges.
Chart 4. Row crops fared better in 2022 vs. select permanent crops amid high inflation
All crop revenue vs. the revenue of select crop groups, 2022 change in crop receipts from 2021
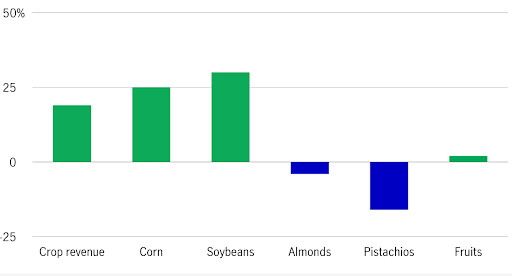
Source: USDA Economic Research Service, as of February 2023.
Crop-specific market factors have at times outweighed inflation impacts on performance
In addition to macroeconomic factors, the impact of agriculture-specific market movements on returns tends to depend on crop-specific factors, outweighing inflation effects. Chart 4 shows the changes in crop revenue in 2022 over 2021 for various crop types. While overall crop revenue increased nearly 20 percent despite high inflation, receipts varied by crop type: corn and soybean revenue increased 25 percent and 30 percent, respectively in 2022, while tree nuts experienced revenue declines as the fruit and nut sector saw flat growth in cash receipts. The drivers behind this varied financial performance indicate root causes beyond inflation, as corn and soybeans benefited from robust export demand in the past two years in addition to recovering domestic demand coming out of the pandemic. Global conflicts that restricted supplies from other countries, the temporary spikes in demand from China, and recovered yields collectively contributed to higher prices and row crop cash receipts in the United States. On the other hand, almonds faced downward pricing pressure due to high stock levels, attributed to logistical challenges slowing shipments, resulting in high inventories despite declining production and, therefore, weighing on total revenue. Pistachio prices fared better than almonds despite global logistical disruptions, yet experienced total revenue decline due to 23 percent lower yields for the 2022 crop.6 These market factors played key roles in determining crop-specific financial performance.
Farmland can offer stability and value protection
In addition to inflation hedging, another key attribute attracting investor interest in farmland is its capacity to preserve value – unlike other asset classes whose value may depreciate over time, land-based natural asset classes such as farmland retain their value. As a tangible and productive asset that meets a basic need and can generate income through agricultural activities, regardless of the inflationary environment, farmland investments offer a valuable source of stability and security. Chart 5 shows that U.S. farmland values have been resilient against downward pressure, with land values appreciating in all but seven years in the past five-plus decades. U.S. institutional farmland investments, as represented by the NCREIF Farmland Index, have generated an annual average land appreciation return of 4.1 percent since the index’s inception in 1991, significantly outpacing the average inflation rate of 2.5 percent during the same period. Overall, farmland’s value-preserving capacity makes it an attractive option for investors looking for a long-term, low-risk investment strategy.
Chart 5. Farmland value remained resistant to downward pressure in different economic environments
Nominal farm real estate values in the U.S.
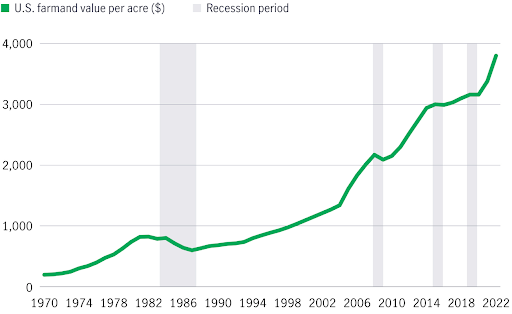
Source: USDA NASS, as of February 2023. Shaded areas represent years in which U.S. farm real estate depreciated in values.
Positive market momentum and inflation protection can make farmland an attractive option for long-term investors
Looking forward, with inflationary pressures forecast to ease, the outlook for farmland investments remains bright. As the world gradually recovers from the production and logistical disruptions resulting from the pandemic, the recent easing of global supply chain disruptions and constraints has enabled global producers to begin moving agricultural products more quickly. Markets are already starting to demonstrate an acceleration in positive momentum. For example, U.S. almond and pistachio exports experienced double-digit percentage increases in recent months, leading to year-over-year growth in volume and more balanced markets.7 The Chilean cherry industry is expected to register a record-setting year for export values, as China’s ports fully reopened and valuable farm goods begin to move more freely.8 Positive market factors, together with the long-term value-preserving characteristics of farmland, continue to highlight agricultural investments as an attractive option for investors looking to hedge against inflation while also generating stable long-term returns.
Citations:
1. U.S. Bureau of Labor Statistics, Consumer Price Index for All Urban Consumers. All Items in U.S. City Average are as of February 2023.
2. U.S. Federal Reserve, as of February 2022.
3. USDA Economic Research Service Farm Income and Wealth Statistics, February 7, 2023.
4. Iowa State University, https://www.extension.iastate.edu/agdm/crops/pdf/a1-20.pdf
5. Washington State University, http://ses.wsu.edu/wp-content/uploads/2020/10/TB73E_2019-Cost-Estimates-of-Establishing-Producing-and-Packing-Fuji-Apples-in-Washington-State.pdf.
6. USDA Foreign Agricultural Service, as of February 2023.
7. Almond Board of California, Position Reports, Administrative Committee for Pistachios, as of February 2023.
8. International Trade Centre, as of February 2023.
Important information
Investing involves risks, including the potential loss of principal. Financial markets are volatile and can fluctuate significantly in response to company, industry, political, regulatory, market, or economic developments. These risks are magnified for investments made in emerging markets. Currency risk is the risk that fluctuations in exchange rates may adversely affect the value of a portfolio’s investments.
The information provided does not take into account the suitability, investment objectives, financial situation, or particular needs of any specific person. You should consider the suitability of any type of investment for your circumstances and, if necessary, seek professional advice.
This material is intended for the exclusive use of recipients in jurisdictions who are allowed to receive the material under their applicable law. The opinions expressed are those of the author(s) and are subject to change without notice. Our investment teams may hold different views and make different investment decisions. These opinions may not necessarily reflect the views of Manulife Investment Management or its affiliates. The information and/or analysis contained in this material has been compiled or arrived at from sources believed to be reliable, but Manulife Investment Management does not make any representation as to their accuracy, correctness, usefulness, or completeness and does not accept liability for any loss arising from the use of the information and/or analysis contained. The information in this material may contain projections or other forward-looking statements regarding future events, targets, management discipline, or other expectations, and is only current as of the date indicated. The information in this document, including statements concerning financial market trends, are based on current market conditions, which will fluctuate and may be superseded by subsequent market events or for other reasons. Manulife Investment Management disclaims any responsibility to update such information.
Neither Manulife Investment Management or its affiliates, nor any of their directors, officers or employees shall assume any liability or responsibility for any direct or indirect loss or damage or any other consequence of any person acting or not acting in reliance on the information contained here. All overviews and commentary are intended to be general in nature and for current interest. While helpful, these overviews are no substitute for professional tax, investment or legal advice. Clients should seek professional advice for their particular situation. Neither Manulife, Manulife Investment Management, nor any of their affiliates or representatives is providing tax, investment or legal advice. This material was prepared solely for informational purposes, does not constitute a recommendation, professional advice, an offer or an invitation by or on behalf of Manulife Investment Management to any person to buy or sell any security or adopt any investment strategy, and is no indication of trading intent in any fund or account managed by Manulife Investment Management. No investment strategy or risk management technique can guarantee returns or eliminate risk in any market environment. Diversification or asset allocation does not guarantee a profit or protect against the risk of loss in any market. Unless otherwise specified, all data is sourced from Manulife Investment Management. Past performance does not guarantee future results.
Manulife Investment Management
Manulife Investment Management is the global wealth and asset management segment of Manulife Financial Corporation. We draw on more than a century of financial stewardship to partner with clients across our institutional, retail, and retirement businesses globally. Our specialist approach to money management includes the highly differentiated strategies of our fixed-income, specialized equity, multi-asset solutions, and private markets teams—along with access to specialized, unaffiliated asset managers from around the world through our multimanager model.
This material has not been reviewed by, is not registered with any securities or other regulatory authority, and may, where appropriate, be distributed by the following Manulife entities in their respective jurisdictions. Additional information about Manulife Investment Management may be found at manulifeim.com/institutional
Australia: Manulife Investment Management Timberland and Agriculture (Australasia) Pty Ltd, Manulife Investment Management (Hong Kong) Limited. Canada: Manulife Investment Management Limited, Manulife Investment Management Distributors Inc., Manulife Investment Management (North America) Limited, Manulife Investment Management Private Markets (Canada) Corp. Mainland China: Manulife Overseas Investment Fund Management (Shanghai) Limited Company. European Economic Area: Manulife Investment Management (Ireland) Ltd. which is authorized and regulated by the Central Bank of Ireland Hong Kong: Manulife Investment Management (Hong Kong) Limited. Indonesia: PT Manulife Aset Manajemen Indonesia. Japan: Manulife Investment Management (Japan) Limited. Malaysia: Manulife Investment Management (M) Berhad 200801033087 (834424-U) Philippines: Manulife Investment Management and Trust Corporation. Singapore: Manulife Investment Management (Singapore) Pte. Ltd. (Company Registration No. 200709952G) South Korea: Manulife Investment Management (Hong Kong) Limited. Switzerland: Manulife IM (Switzerland) LLC. Taiwan: Manulife Investment Management (Taiwan) Co. Ltd. United Kingdom: Manulife Investment Management (Europe) Ltd. which is authorized and regulated by the Financial Conduct Authority
United States: John Hancock Investment Management LLC, Manulife Investment Management (US) LLC, Manulife Investment Management Private Markets (US) LLC and Manulife Investment Management Timberland and Agriculture Inc. Vietnam: Manulife Investment Fund Management (Vietnam) Company Limited.
Manulife, Manulife Investment Management, Stylized M Design, and Manulife Investment Management & Stylized M Design are trademarks of The Manufacturers Life Insurance Company and are used by it, and by its affiliates under license.
*The content put forth by Global AgInvesting News and its parent company HighQuest Partners is intended to be used and must be used for informational purposes only. All information or other material herein is not to be construed as legal, tax, investment, financial, or other advice. Global AgInvesting and HighQuest Partners are not a fiduciary in any manner, and the reader assumes the sole responsibility of evaluating the merits and risks associated with the use of any information or other content on this site.